Query Builder templates
Access Query Builder templates by selecting Query Template when creating a report. All templates surface data from up to the last 60 days, but you can directly edit that and other values in the editor.
Channel templates
| Query name | Description |
|---|---|
| Channel engagement and revenue | For each channel, you’ll see all engagement metrics for that channel (for example, opens and clicks), revenue, number of transactions, and average price.
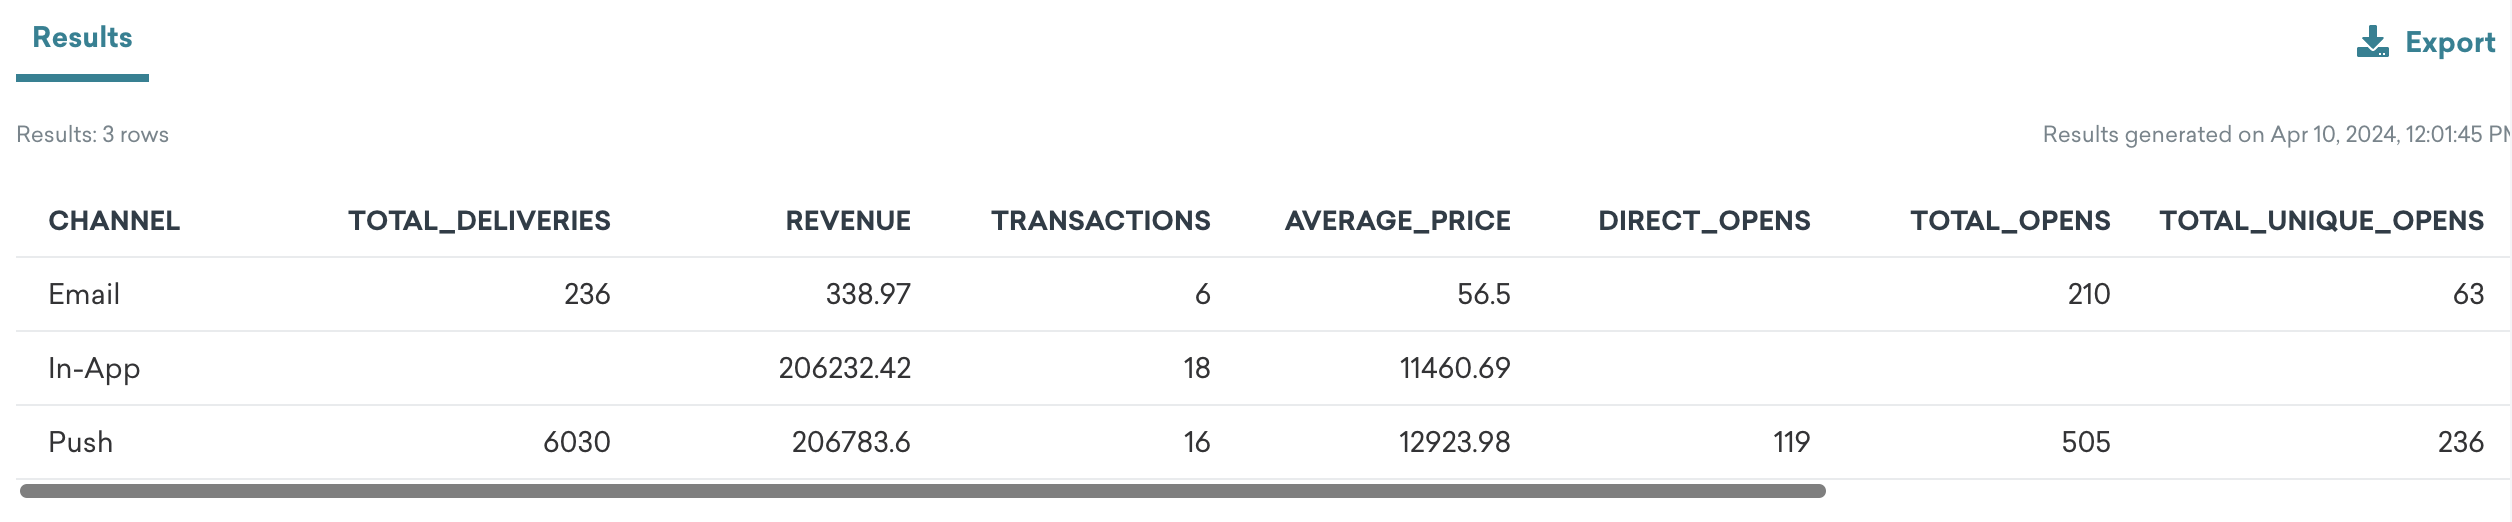 |
| Purchases and revenue by segment | This report provides metrics for the messages sent for a specific segment. Purchase metrics are unique throughout the reporting period. One user can generate at most one purchase. Revenue takes into account every purchase from the reporting period. |
| Purchases and revenue for variants or steps, by segment | This report provides metrics for the variants or Canvas steps of the messages sent to each segment. Purchase metrics are unique throughout the reporting period. One user can generate at most one purchase. Revenue takes into account every purchase from the reporting period. |
| Top/bottom messaging for purchases | This report shows purchase metrics for the top or bottom campaigns, Canvases, or Canvas steps. Each row is a campaign, Canvas, or Canvas step. You must specify whether to display the top or bottom performers, and the specific metric to run this analysis for (such as Unique purchases upon receipt, Revenue upon receipt, Unique recipients). The rows in top performer reports will be ordered from best to worst, while the rows in bottom performer reports will be ordered from worst to best. |
Campaign templates
| Query name | Description |
|---|---|
| Campaign revenue by country | This report provides revenue per country for a specific campaign. To run this report, you must specify the API identifier for a campaign. You can find a campaign’s API identifier at the bottom of that campaign’s details page. For each country, you’ll see the amount of revenue generated, number of orders, number of returns, net revenue, and gross revenue.
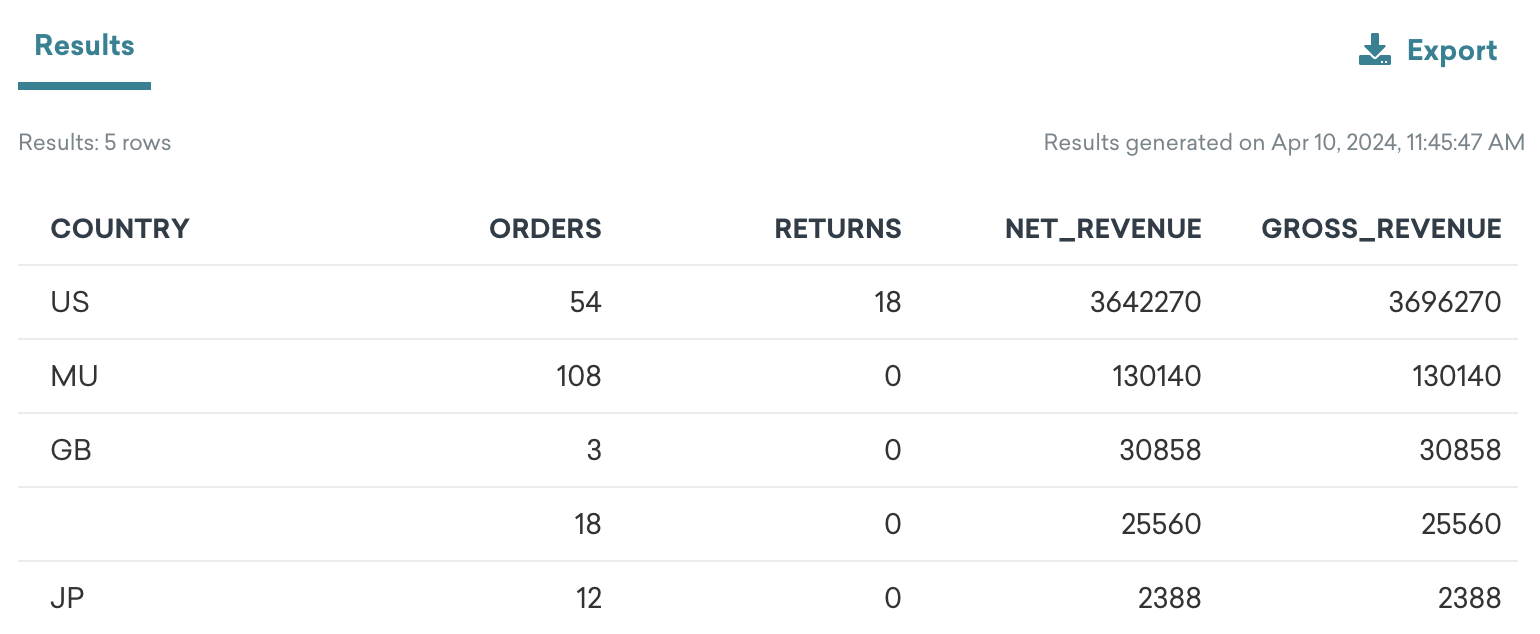 |
Canvas templates
| Query name | Description |
|---|---|
| Canvas revenue by country | This report provides revenue per country for a specific Canvas. To run this report, you must specify the API identifier for a Canvas. You can find the Canvas API identifier under Analyze Variants. For each country, you’ll see the amount of revenue generated, number of orders, number of returns, net revenue, and gross revenue.
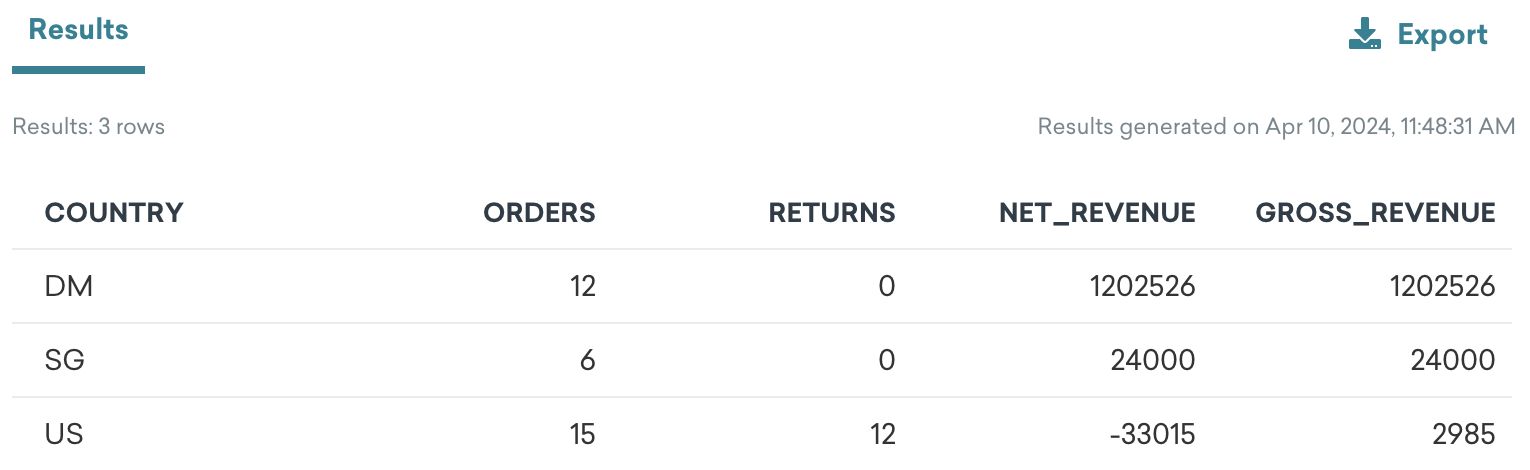 |
Email templates
| Query name | Description |
|---|---|
| Email bounces per domain | The number of bounces per email domain, broken down into total bounces, hard bounces, and soft bounces. 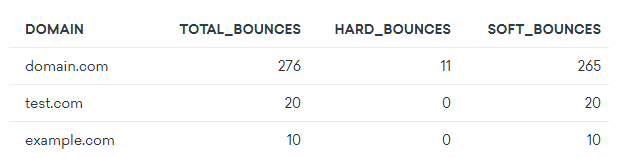 |
| Email delivery metrics by day | This report provides metrics for the messages sent on each day, such as how many emails were sent, delivered, soft bounced, and hard bounced. All metrics are unique throughout the reporting period. For example, if a welcome email soft bounced one time on November 21, two times on November 22, and was never delivered:
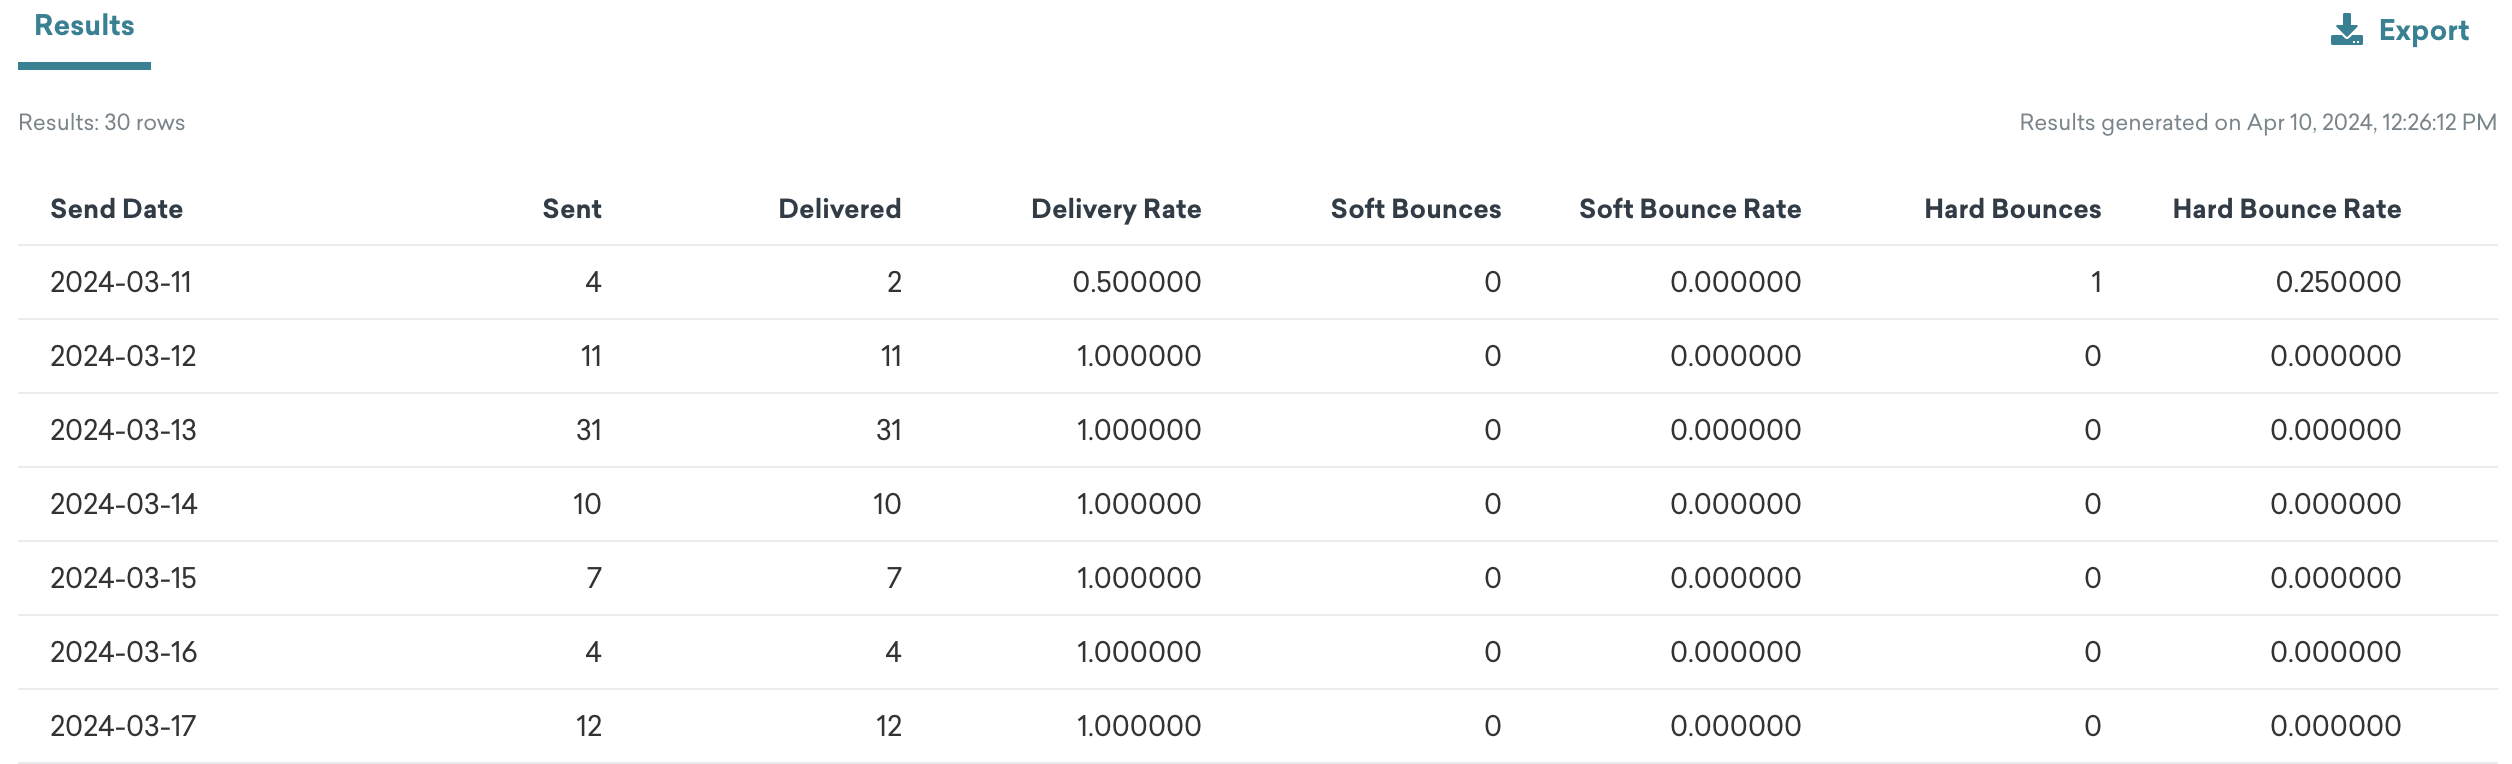 |
| Email engagement metrics by segment | This report provides metrics for the messages sent to each segment, such as how many emails were sent, delivered, soft bounced, and hard bounced. All metrics are unique throughout the reporting period. For example, if a welcome email soft bounced one time on November 21, two times on November 22, and was never delivered:
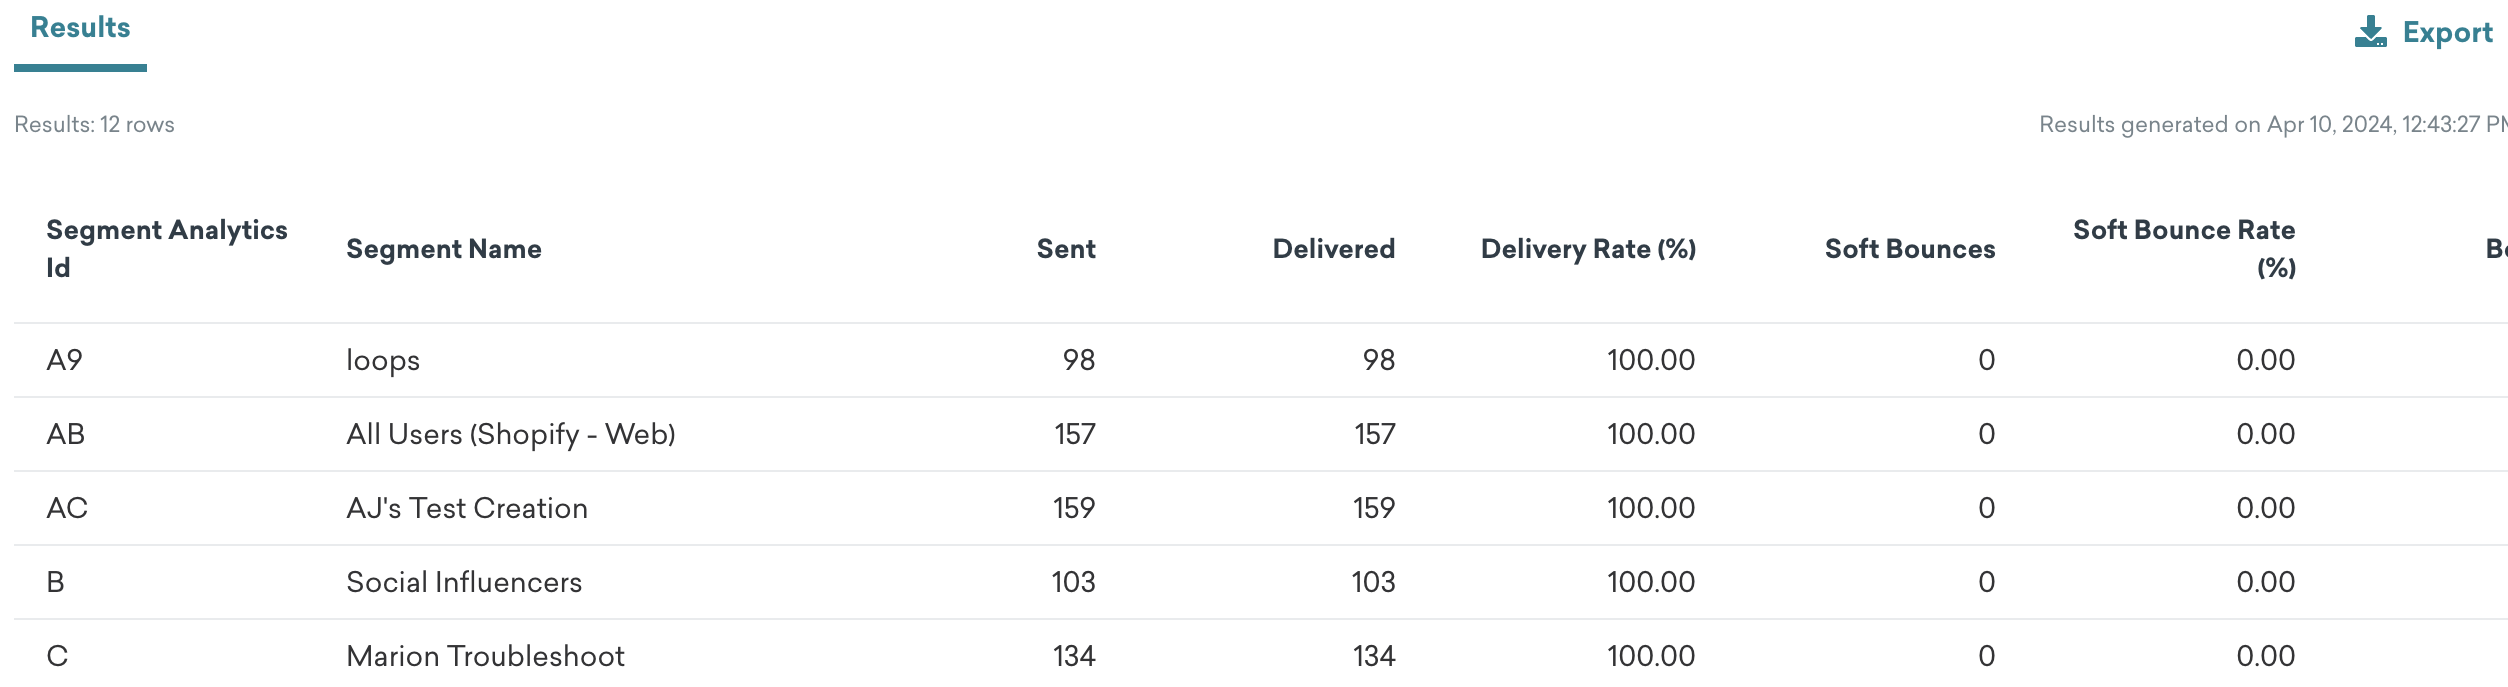 |
| Email engagement metrics for variants or steps, by segment | This report provides metrics for the variants or Canvas steps of the messages sent to each segment. These metrics include how many emails were sent, delivered, soft bounced, and hard bounced. All metrics are unique throughout the reporting period. For example, if a welcome email soft bounced one time on November 21, two times on November 22, and was never delivered:
|
| Email performance by country | For each country, you’ll see the following metrics: sends, indirect open rate, and direct open rate. Country is the country of the user at the time of push send. 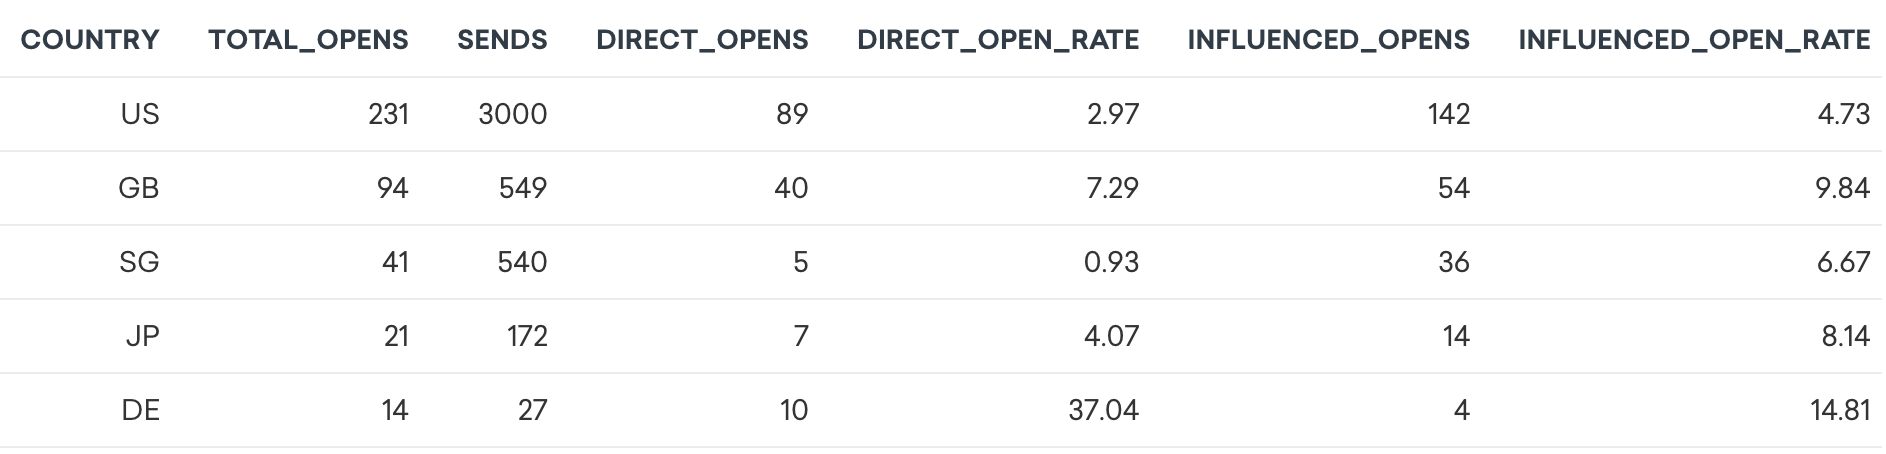 |
| Email Subscription Change Logs | For each user, you’ll see the metrics that were logged about their subscription change, such as their email address, subscription status, the time their status was changed, and the associated Canvas or campaign. |
| Email subscription group opt-ins and opt-outs | For each week, you’ll see the number of unique user opt-ins and opt-outs of any email subscription group. 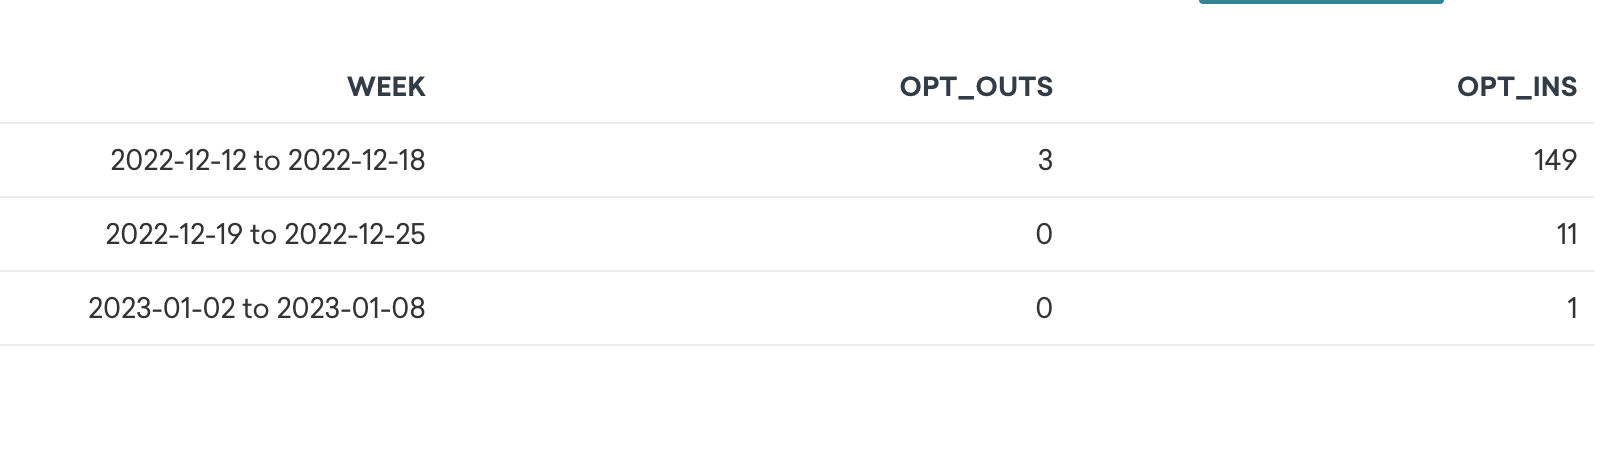 |
| Email URLs clicked | This report shows the number of clicks each link in an email had. To run this report, you’ll need to specify the API identifier for a campaign or Canvas. You can find a campaign’s API identifier at the bottom of that campaign’s details page and the Canvas API identifier under Analyze Variants. For each de-personalized link, you’ll see a count of clicks. Your CSV download will include the user IDs of all users that clicked, the link they clicked on, and a timestamp of when they clicked. De-personalized URLs: URLs that are stripped of Liquid tags. 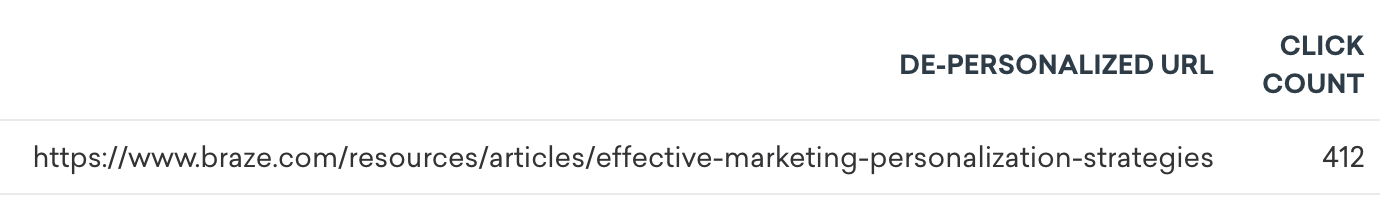 |
| Top/bottom messaging for email engagement | This report shows email engagement metrics for the top or bottom campaigns, Canvases, or Canvas steps. You must specify whether to display the top or bottom performers, and the specific metric to run this analysis for (such as Sent, Soft Bounces, and Unique Opens). The rows in top performer reports will be ordered from best to worst, while the rows in bottom performer reports will be ordered from worst to best. 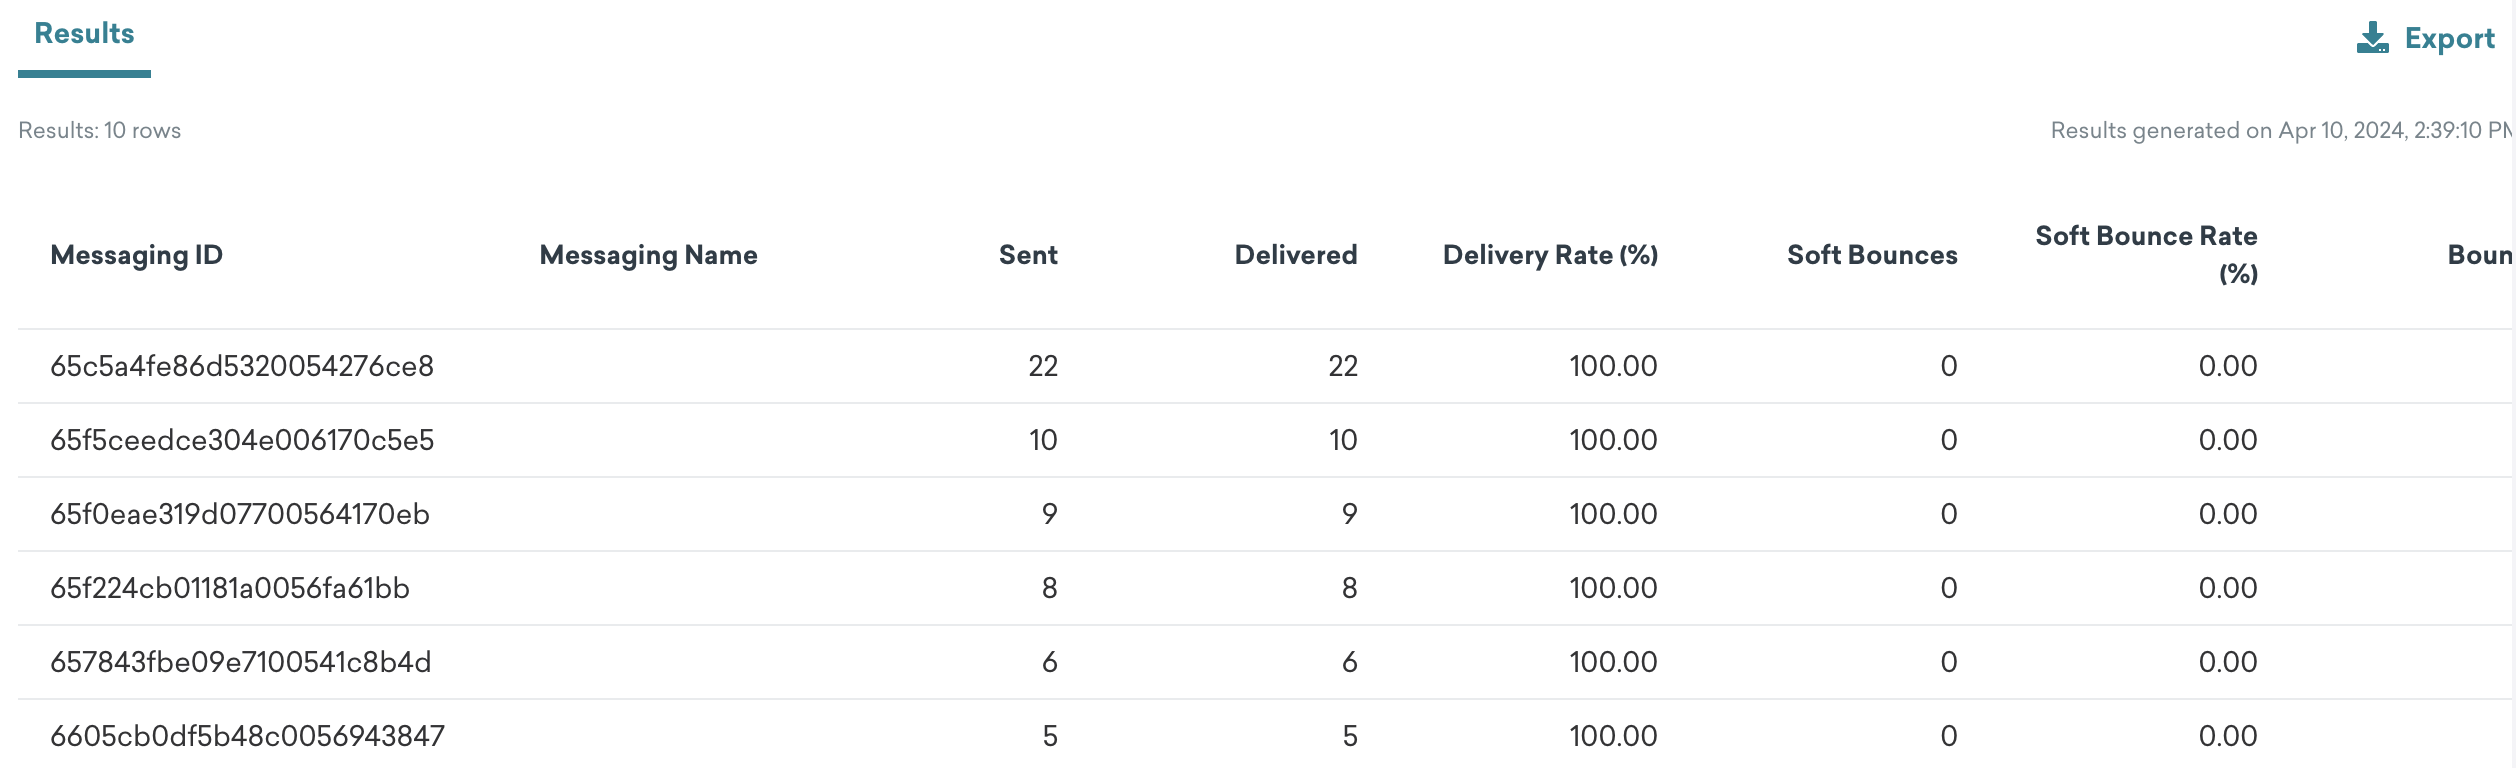 |
Mobile templates
| Query name | Description |
|---|---|
| Device carriers | The number of users per device carrier, such as Verizon and T-Mobile. 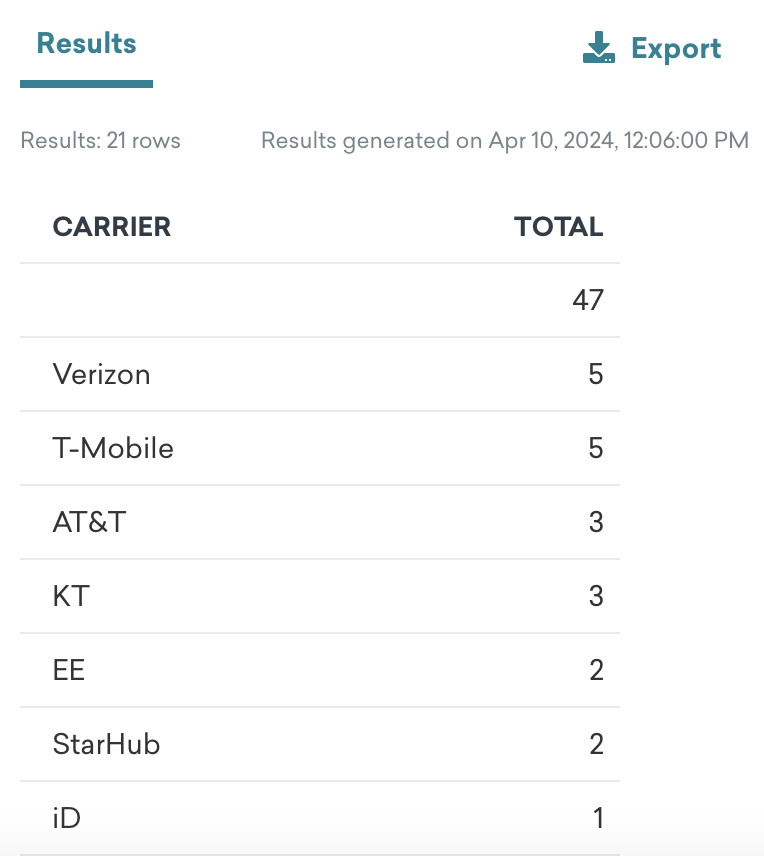 |
| Device models | The number of users per device model, such as iPhone 15 Pro and Pixel 7. 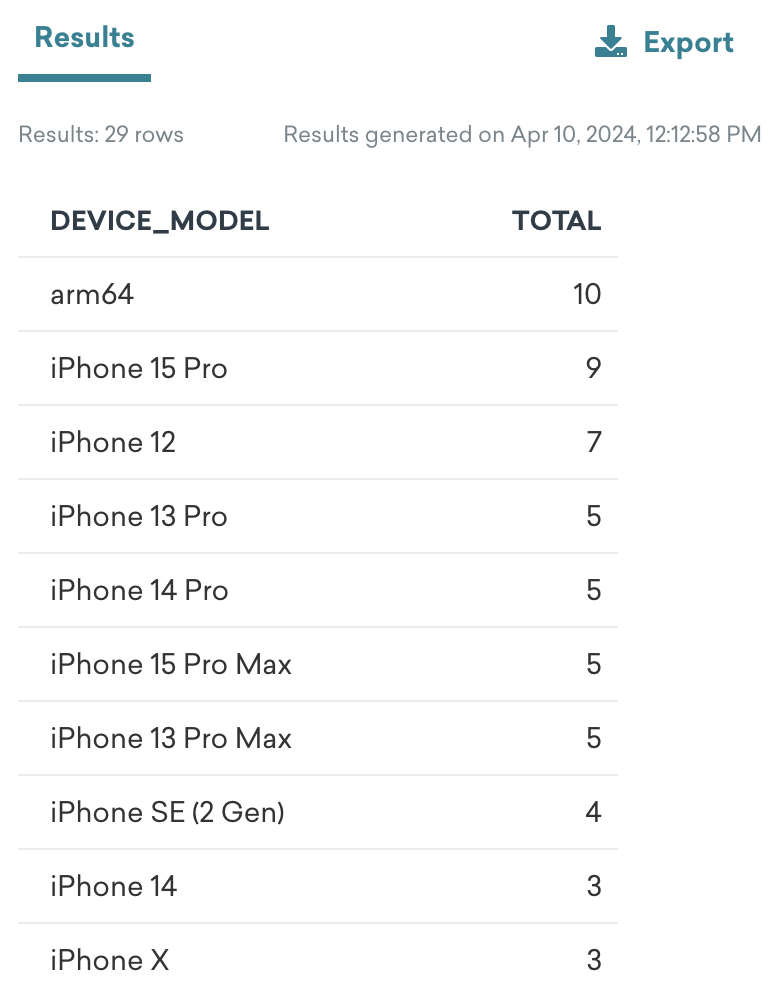 |
| Device operating systems | The number of users per operating system, such as 17.4 and Android 14. 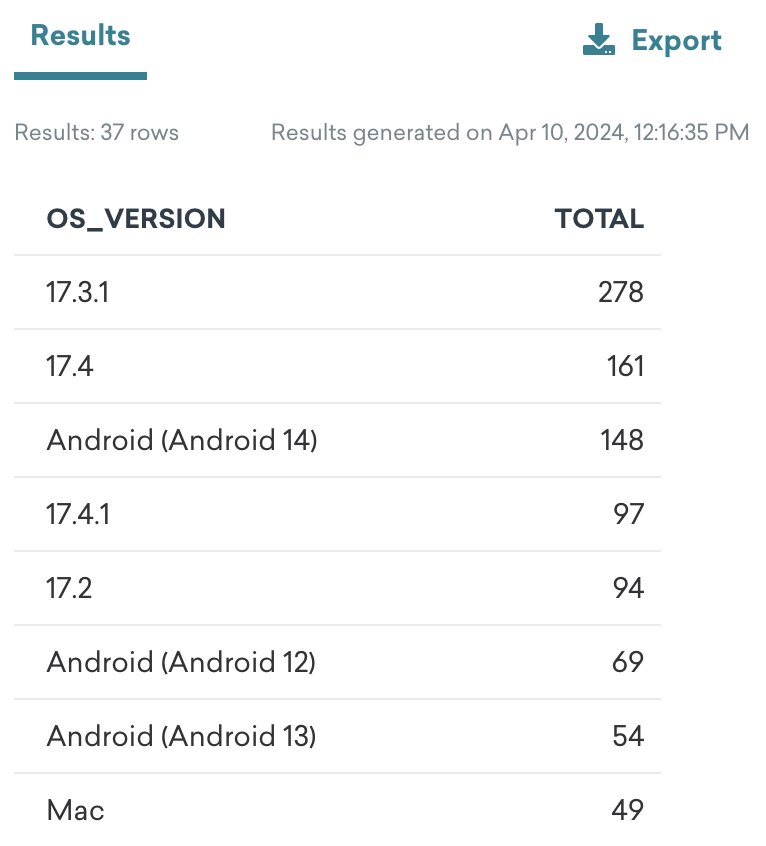 |
| Device screen resolutions | The number of users per device screen resolution, such as 1179x2556 and 750x1334. 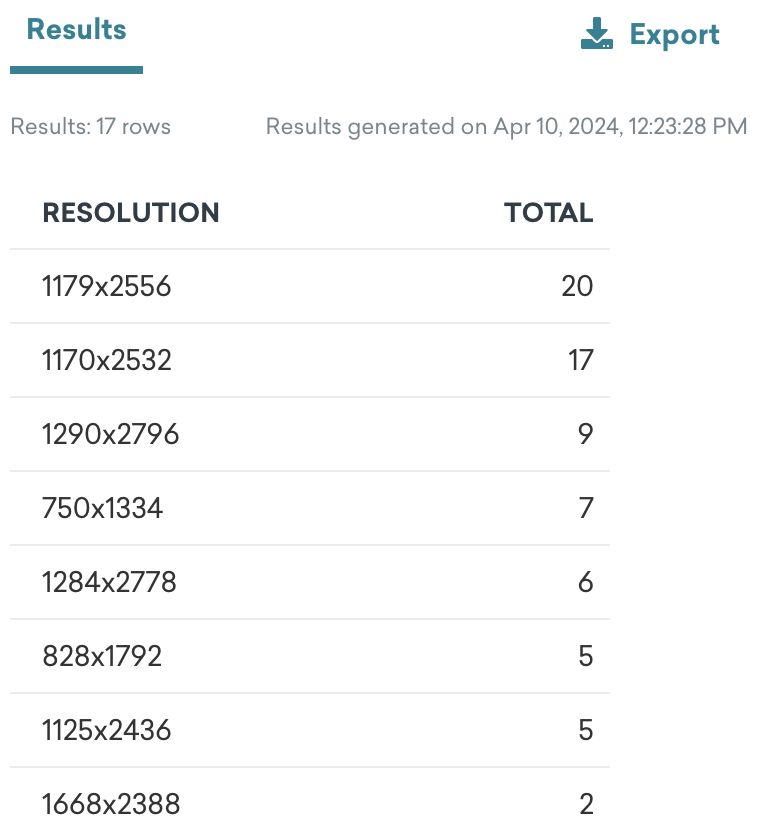 |
| SMS Error Codes | For each SMS error code, you’ll see the error type and number of errors. 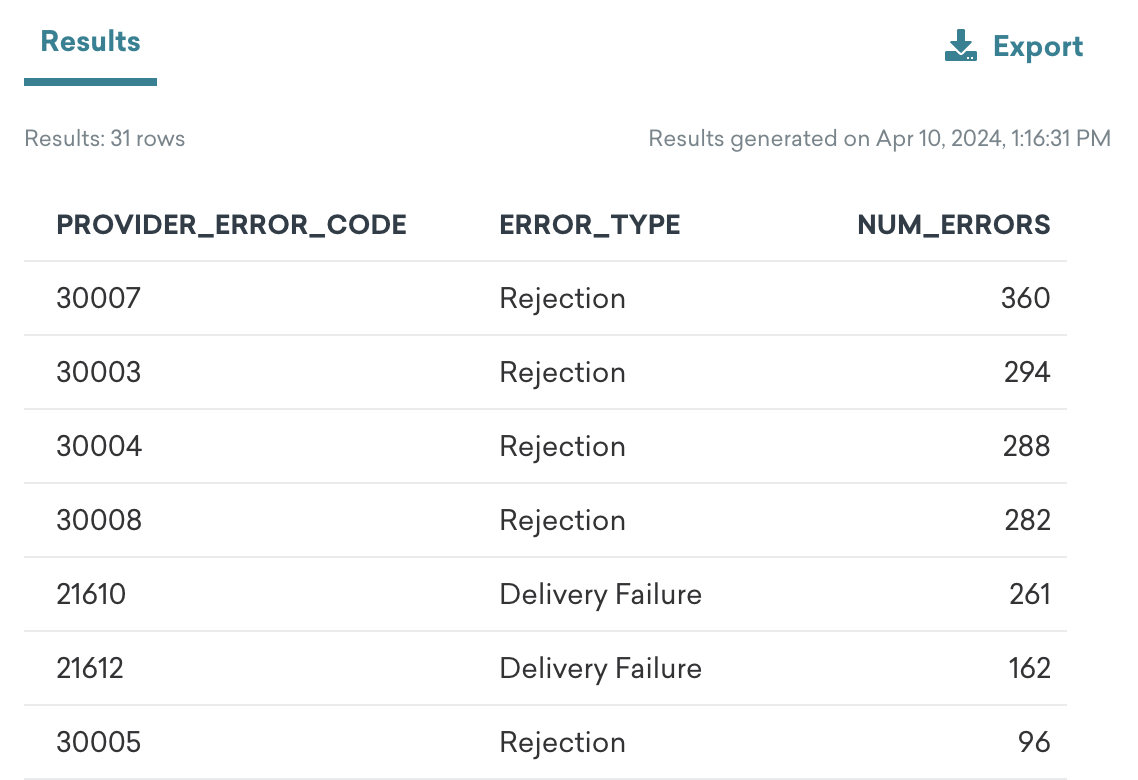 |
| SMS Provide Errors by User | This report provides SMS error codes for a specific user. |
Push templates
| Query name | Description |
|---|---|
| Push performance by country | For each country, you’ll see the following metrics: deliveries, open rate, and click rate. Country is the country of the user at the time of email send. 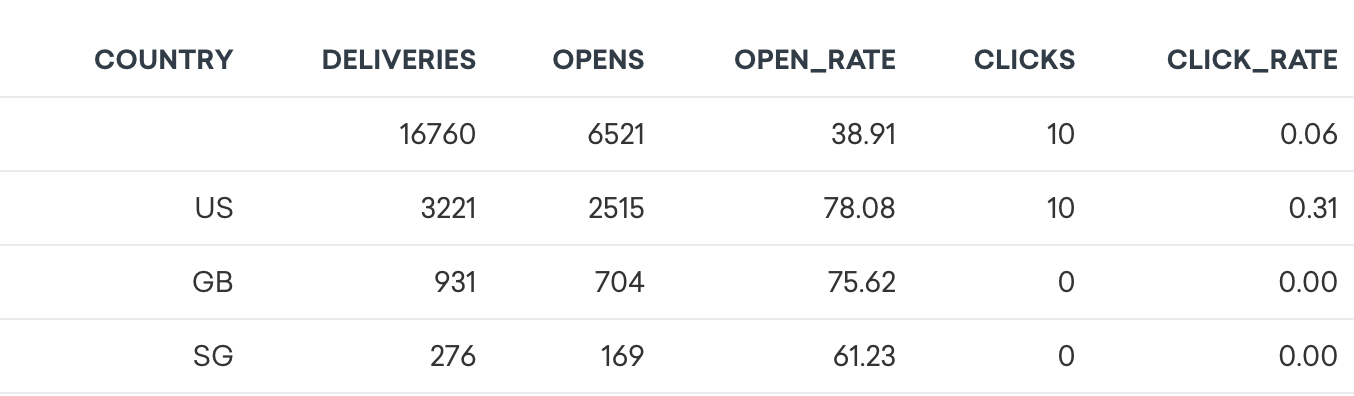 |
 Edit this page on GitHub
HOW HELPFUL WAS THIS PAGE?