Creating a churn prediction
Learn how to create a churn prediction within the Braze dashboard.
Step 1: Create a new prediction
In Braze, go to Analytics > Predictive Churn.
If you are using the older navigation, you can find Predictions under Engagement.
A prediction is one instance of a trained machine learning model and all the parameters and data it uses. On this page, you will see a list of current active predictions along with some basic information about them. Here, you can rename, archive, and create new predictions. Archived predictions are inactive and do not update user scores.
To create a new prediction, choose Create Prediction and select a new Churn Prediction.
There is a limit of five concurrently active churn predictions. Prior to purchasing Predictive Churn, the limit is one active preview churn prediction. A preview churn prediction will not regularly update scores or allow you to target users based on the prediction’s output. Contact your account manager for details.
On the Basics page, give your new prediction a unique name. You can also provide an optional description to take any notes on this particular prediction.
Click Forward to move to the next step. Optionally, you can click Build Now to use all the default settings and skip to the last step of creation. You will have a chance to review the settings before starting the build process. You can return to any step later by selecting it in the progress tracker on the top.
Step 2: Define churn
In the Churn Definition panel, use the provided filters to specify how you define user churn for your business. In other words, what does a user have to do in what time frame for you to consider them churned?
Remember, you don’t need to explain what behaviors might precede churn—only what makes a user a churned user. Think of this in terms of something a user either does once (do) or stops doing (do not) that constitutes churning. For example, you might consider users who haven’t opened your app in 7 days to be churned. You might consider uninstalling, or custom events like unsubscribing, disabling an account, or others to cause a user to become churned.
Churn window
Churn window is the time frame in which a user performs the behavior specified to constitute churning. It can be set up to 60 days. This window is used to query historical data for training the prediction. Additionally, after the prediction is created and users receive scores, the Churn Risk Score indicates how likely a user is to churn within the number of days specified by the churn window.
Here’s an example of a simple definition based on lapsing sessions in the last 7 days.
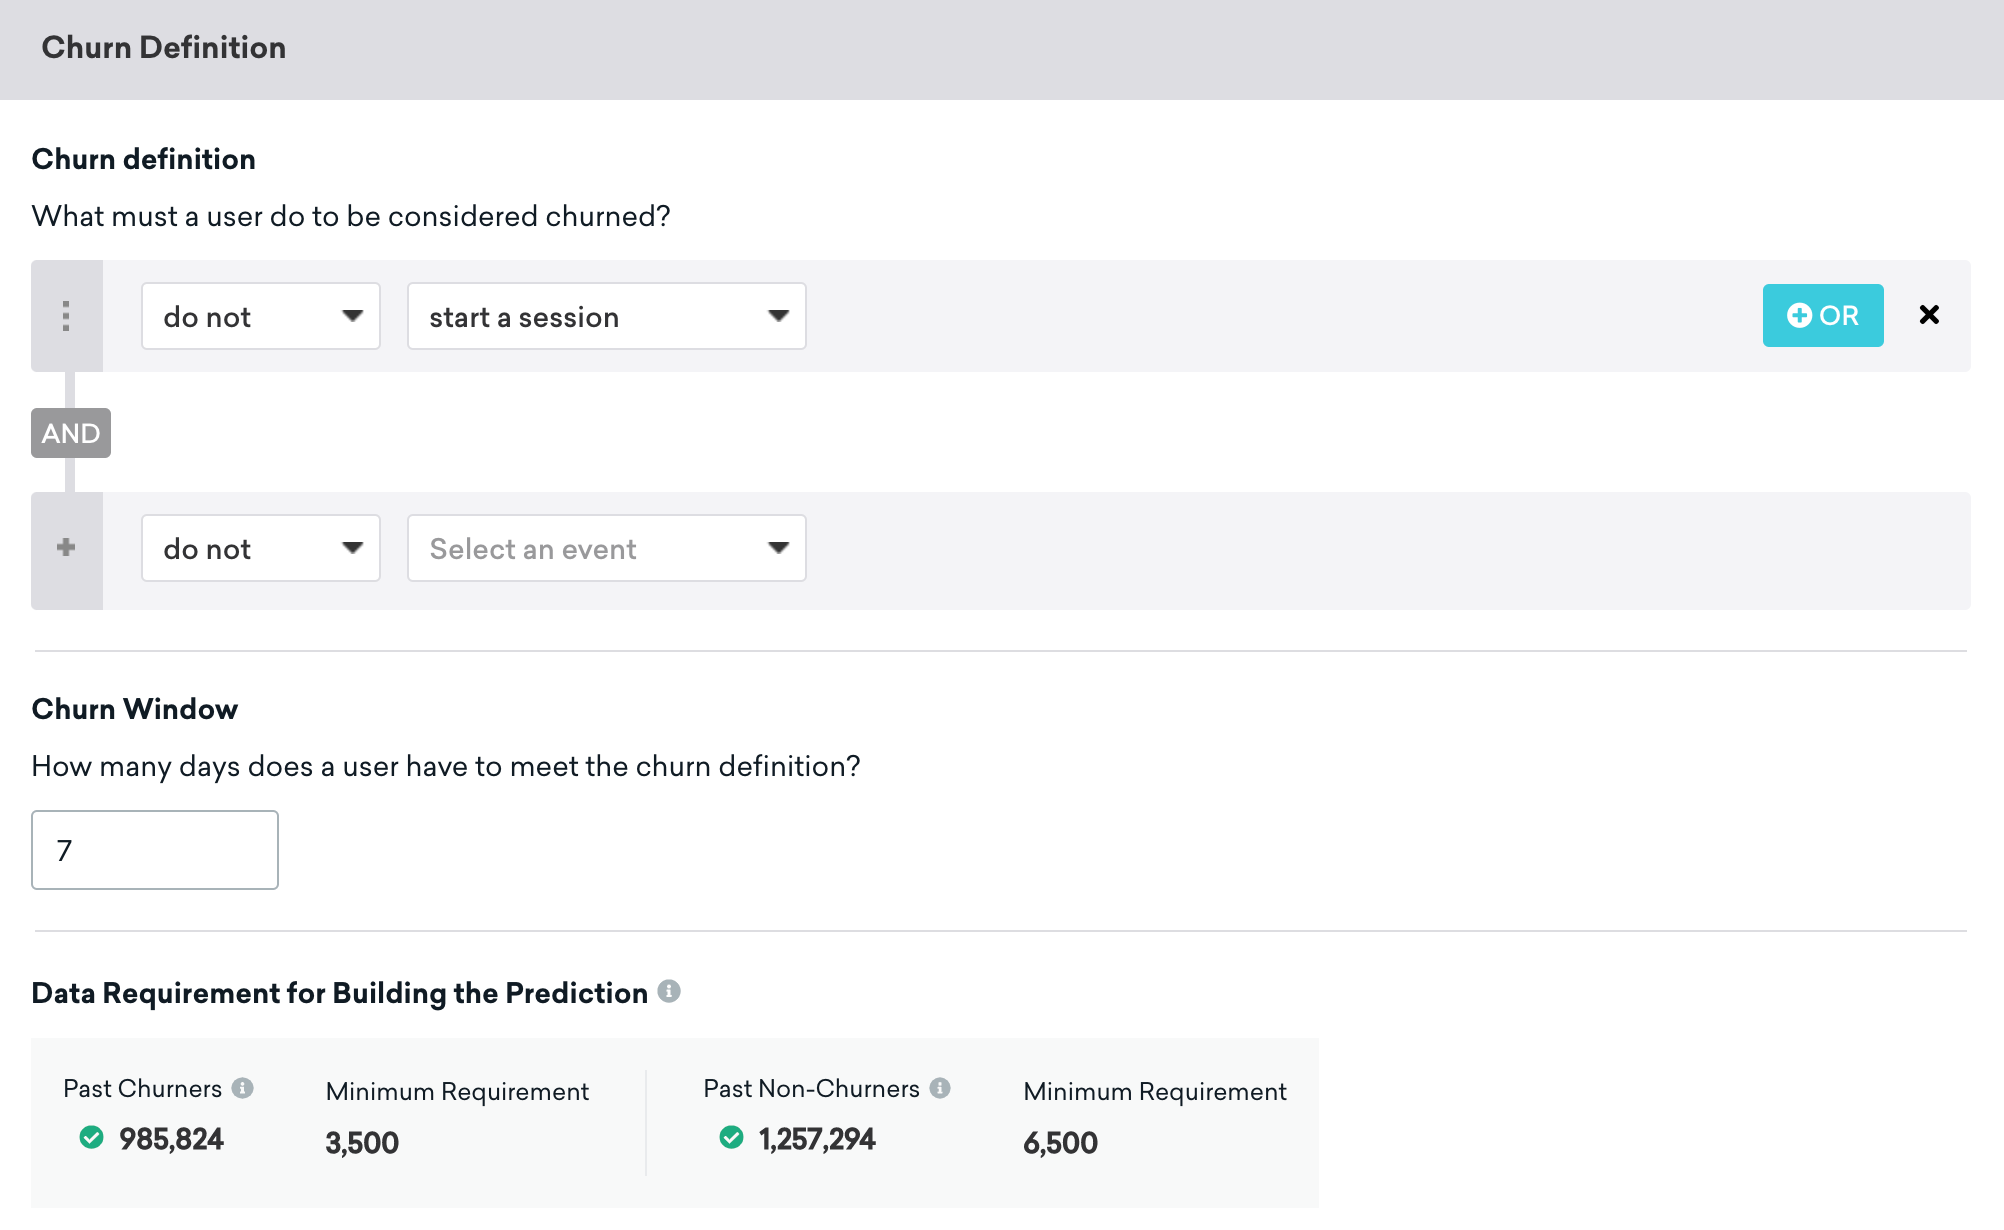
For this case, we select do not and start a session. You can combine other filters with AND and OR as you see fit to create the definition you need. Interested in some potential churn definitions to consider? You can find some inspiration in the following section on Sample churn definitions.
For do, we assume that active users did not take the action you specify for this row prior to becoming churned. Doing the action causes them to become churned.
For do not, we consider active users to be those that did do that action in the days prior, and then stopped.
Underneath the definition, you will see estimates of how many users (in the past who churned and who didn’t churn according to your definition) are available. You will also see the minimum values required. Braze must have this minimum count of users available in historical data so that the prediction has enough data to learn from.
Step 3: Filter your prediction audience
Your prediction audience is the group of users you want to predict churn risk for. By default, this will be set to All Users, which means that this prediction will create churn risk scores for all of your active users. Usually, the model will likely perform better if you narrow down and filter the group of users you want to prevent from churning with some criteria. Think about the specific users who mean the most to you that you’d like to retain and define them here. For example, you might want to retain users who first used the app more than a month ago or have ever made a purchase.
The prediction audience cannot exceed 100 million users.
When the prediction window is 14 days or less, the time window for filters that begin with “Last…” like “Last Used App” and “Last Made Purchase” cannot exceed the Churn Window specified in the churn definition. For example, if your churn definition has a window of 14 days, the time window for the “Last…” filters cannot exceed 14 days.
Full Filter Mode
In order to build a new prediction immediately, only a subset of Braze segmentation filters are supported. Full Filter Mode allows you to use all Braze filters but will require one churn window to build the prediction. For example, if the churn window is set to 15 days, it will take 15 days to collect the user data and build the prediction when using filters only supported in Full Filter Mode. Additionally, some estimates about audience sizes will not be available in Full Filter Mode.
For a sample list of prediction audience definitions, check out our sample definitions in the following section on Sample churn definitions.
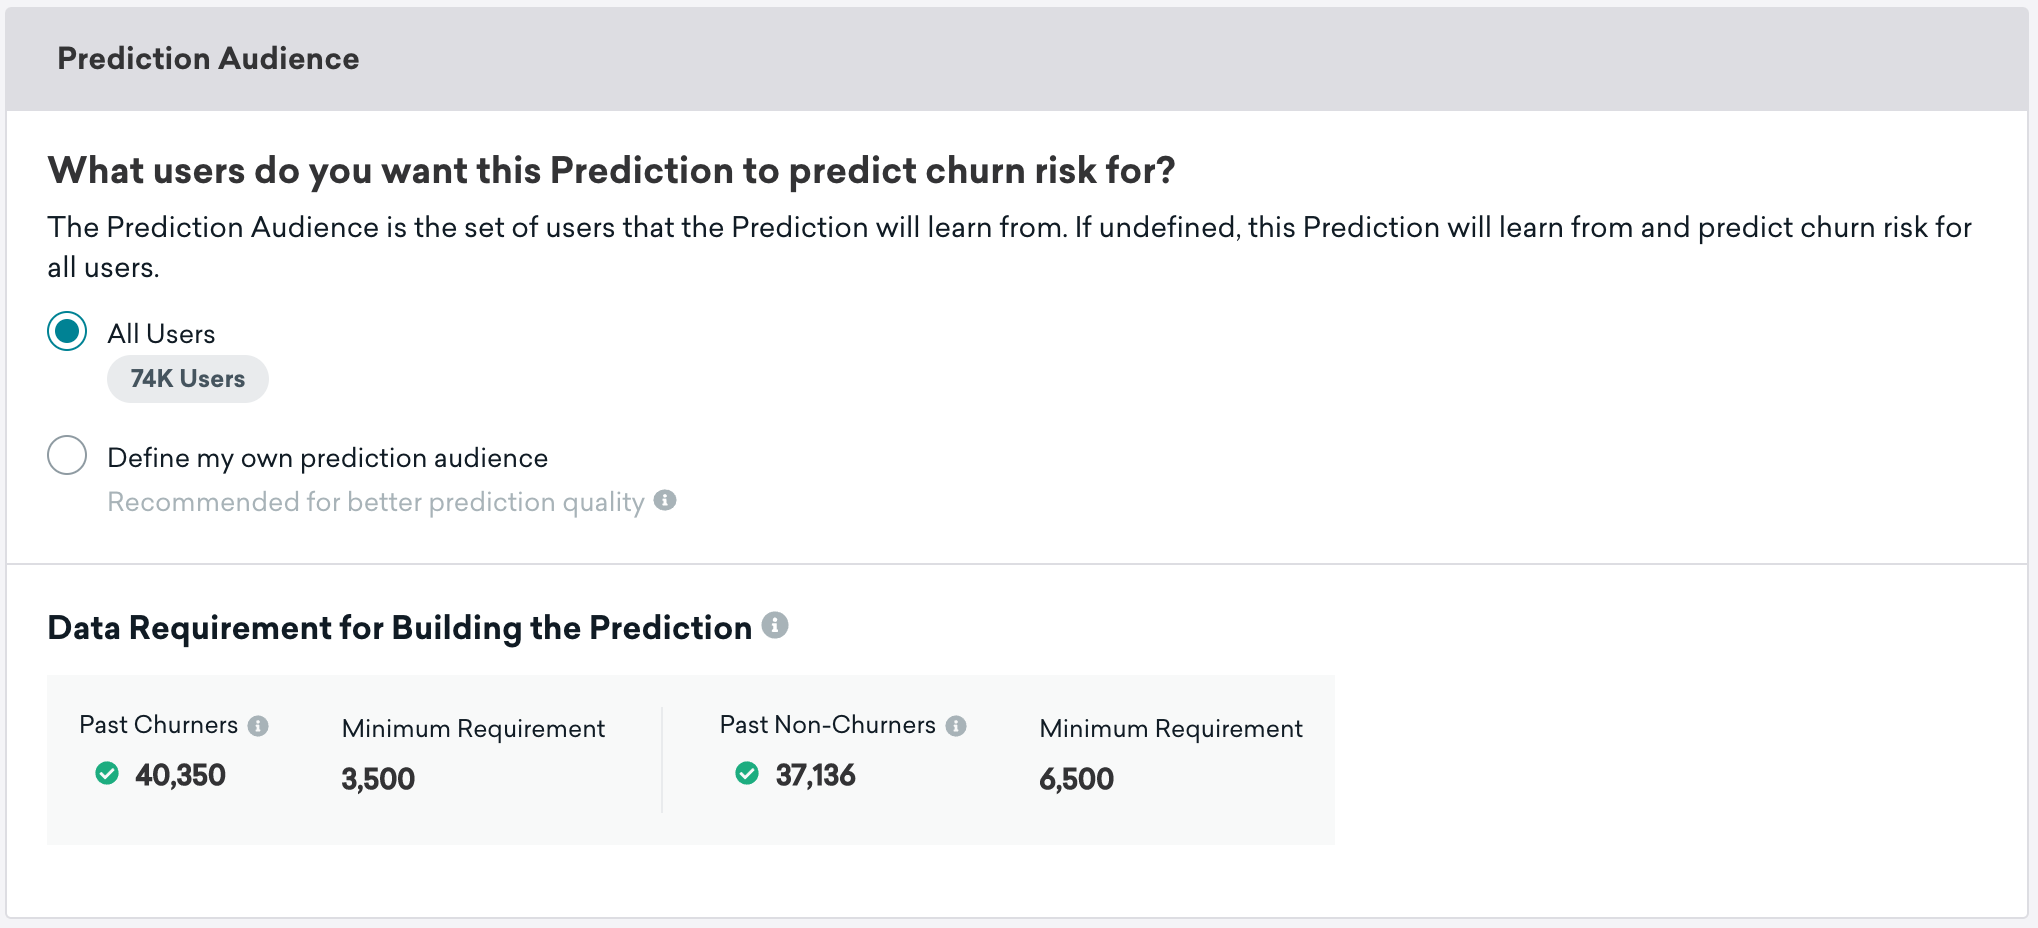
Just like the previous page, the bottom panel will show you the estimated number of historic users that result from your churn definition and prediction audience definition. These estimates must meet the minimum requirements shown in order to create a prediction.
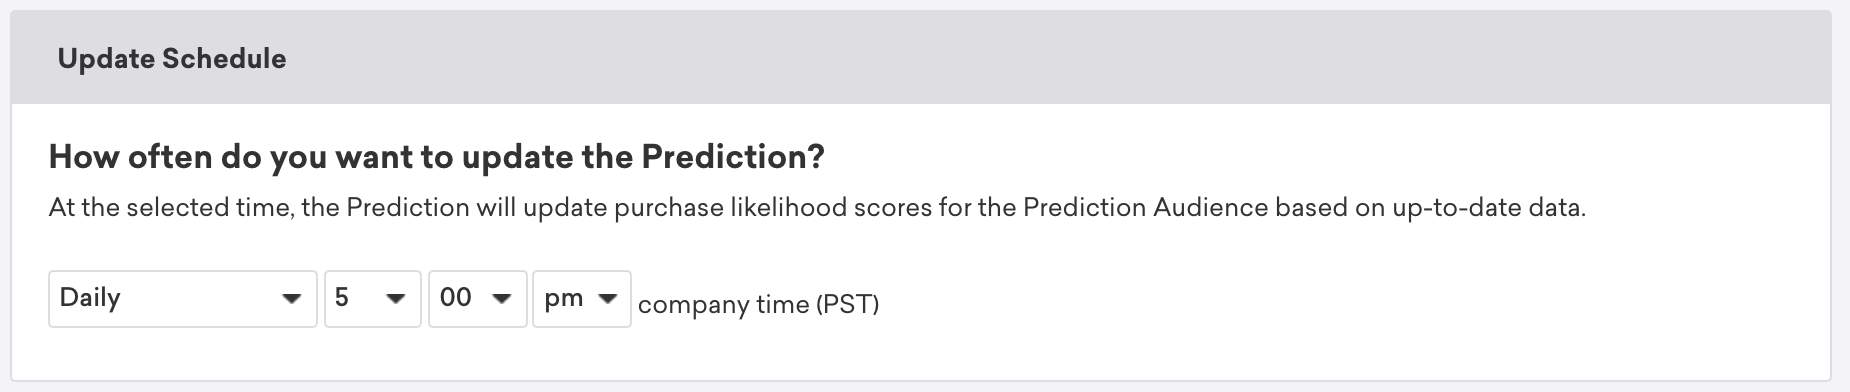
Step 4: Choose the update frequency for churn prediction
The machine learning model created when you complete this page will be used on a schedule you select here to generate fresh churn risk scores. Select the maximum frequency of updates that you’ll find useful. For example, if you’re going to send a weekly promotion to prevent users from churning, set the update frequency to Weekly on the day and time of your choosing.
Preview and demo prediction will never update users’ risk of churn. Additionally, daily updates for predictions require an additional purchase beyond weekly or monthly updates with Predictive Churn. To purchase this functionality, contact your account manager.
Step 5: Build prediction
Verify that the details you’ve provided are correct, and choose Build Prediction. You can also save your changes in draft form by selecting Save As Draft to return to this page and build the model later. After you click Build Prediction, the process that generates the model will begin. This could take between 30 minutes to a few hours depending on data volumes. For this prediction, you will see a page explaining that training is in progress for the duration of the model building process.
Once it’s done, the page will switch to the Analytics view automatically, and you will also get an email informing you that the prediction and results are ready. In the event of an error, the page will return to the Editing mode with an explanation of what went wrong.
The prediction will be rebuilt (“retrained”) again every two weeks automatically to keep it updated on the most recent data available. Note that this is a separate process from when users’ Churn Risk Scores, the output of the prediction, are produced. The latter is determined by the update frequency you chose in Step 4.
Sample churn and prediction audience definitions
Sample Churn Definitions
- “Within 7 days, do custom event ‘Subscription Cancellation’“
- “Within 30 days, do custom event ‘Trial Expired’“
- “Within 1 day do uninstall.”
- “Within 14 days do not Make a Purchase.”
For the churn definitions we outlined, there might be some corresponding prediction audience definitions:
- Started subscription more than 2 weeks ago OR Started subscription less than two weeks ago
You might want to create 2 predictions in this case and then message new subscribers differently than longer-term subscribers. You could also define this as “First Made Purchase more than 30 days ago.” - Uninstallers
You might focus on customers who have purchased something in the recent past or used the app very recently. - Those at risk of not purchasing as a definition of churn
You may want to focus on customers who have been browsing or searching or engaging with your app more recently. Perhaps the right discount intervention will prevent this more engaged group from churning.
Archived predictions
Archived predictions will stop updating user scores. Any archived prediction that is unarchived will continue updating user scores on its predetermined schedule. Archived predictions are never deleted and remain in the list.
 Edit this page on GitHub